Decrypting GuLoader with new Ghidra Emulator
Recently, together with the release of version 10.3, Ghidra introduced new debugging and emulation capabilities in its GUI. In fact, both debugger and emulator were already available before, but only from scripting API. In this post, we will use this new emulation mode in Ghidra to decrypt the first stage of the shellcode in the older GuLoader sample.
Sample
For this post, we will use the following older GuLoader shellcode sample:
- MD5: c2273ac30f174a44f4c78fb91d47bd3c
- SHA-1: ade10361020ae4e8a253b5e72780b6e3a69c4be9
- SHA-256: 4f4d3dfab7ce5c37067f65151613c1642bbec5ed41c6945e47f55206233042e8
https://www.virustotal.com/gui/file/4f4d3dfab7ce5c37067f65151613c1642bbec5ed41c6945e47f55206233042e8/details https://malshare.com/sample.php?action=detail&hash=4f4d3dfab7ce5c37067f65151613c1642bbec5ed41c6945e47f55206233042e8
Loading shellcode to the emulator
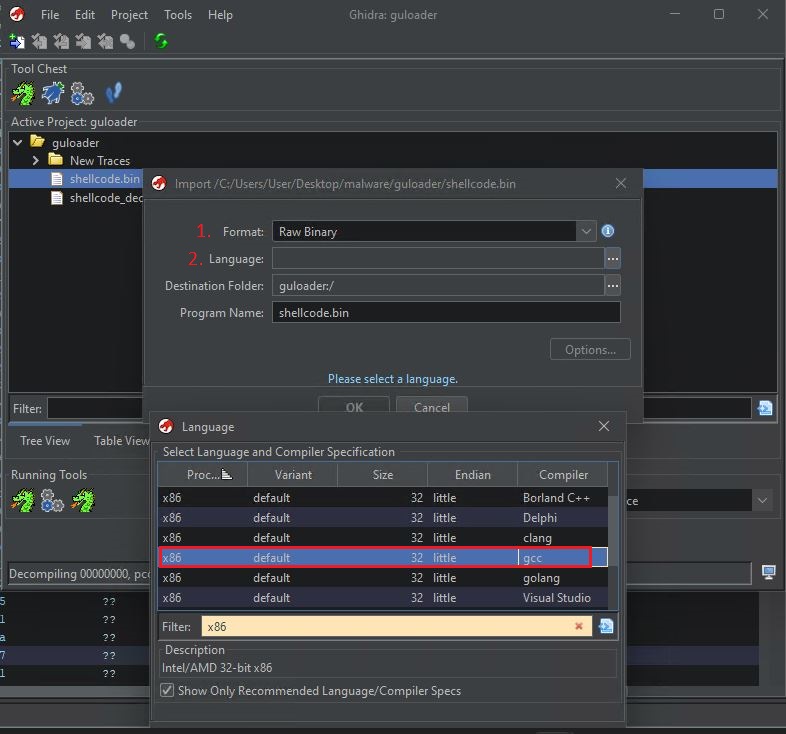
First, we need to load our shellcode to Ghidra. To do this, simply open the shellcode file in Ghidra. It won’t detect the type and architecture automatically since there is no PE header, so we must set it manually. To do that, choose language as x86 default 32 little gcc and press ok. Now the code should open in the disassembler.
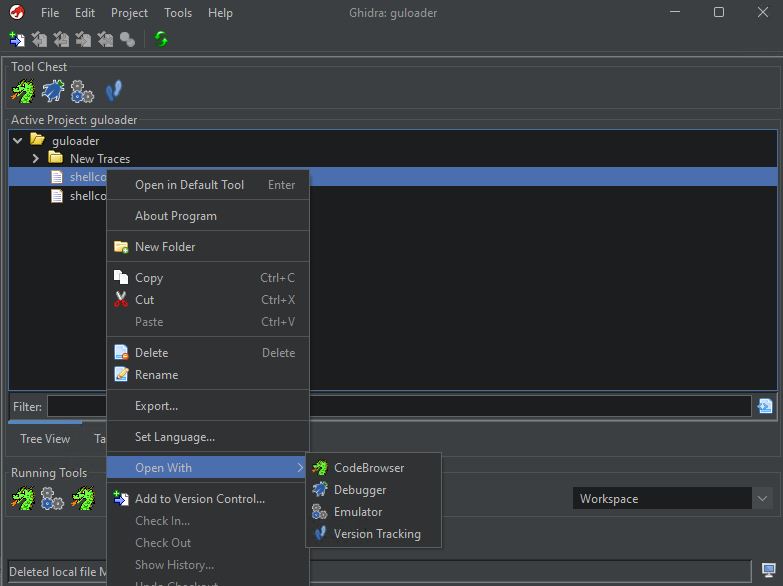
What we want to do is to open it in the emulator. To do this right click on the code and choose Open with -> Emulator
Emulator UI overview
The emulator view is quite similar to the one we know from disassembler but with a few additional windows (which I recommend reorganizing for a better fit, the original placement of windows is not very intuitive):

Let’s quickly dissect the layout (descriptions are taken from Ghidra Docs):
- The Debug Console window: This displays logging messages and problems encountered during a session. Some problems are presented with remedial actions, which may expedite your workflow or aid in troubleshooting.
- The Dynamic Listing window: This is the primary means of examining the instructions being executed. By default, it follows the program counter and disassembles from there until the next control transfer instruction. It supports many of the same operations as Static Listing, including patching.
- The Listing window. This is a static code listing known from the Ghidra disassembler. The main difference from Dynamic Listing is that the code listed here does not change during emulation.
- The Modules window: It displays the images (and sections, if applicable) loaded by the target. Note that this differs from the Regions window.
- The Registers window: It displays and edits the register values for the current thread.
- The Breakpoints window: It lists and manages the breakpoints among all open images and running targets.
- The Stack window: This lists the stack frames for the current thread.
- The Regions window: It lists memory regions for the current target. It differs from the Modules window since this includes not only image-backed regions but other memory regions, e.g., stacks and heaps.
- The Watches window: It manages current watches. These are not watchpoints but rather expressions or variables whose values are to display. To manage watchpoints, use the Breakpoints window or the Interpreter.
- The Threads window: This lists the threads in the current target. The tabs at the top list the active targets.
Emulating code and decrypting shellcode
After we load the shellcode, we need to press “D” on the first instruction in the listing to disassemble the bytecode. Since this is a shellcode, it won’t disassemble automatically during analysis.
After we disassemble the first instructions, we can easily identify a decryption loop. This decrypts the rest of the shellcode and then jumps to it. After the indirect jump, our code will be garbage. This is normal as it is in the encrypted form. Our goal for this blog post is to use the Ghidra emulator to decrypt and save the decrypted shellcode for further analysis.
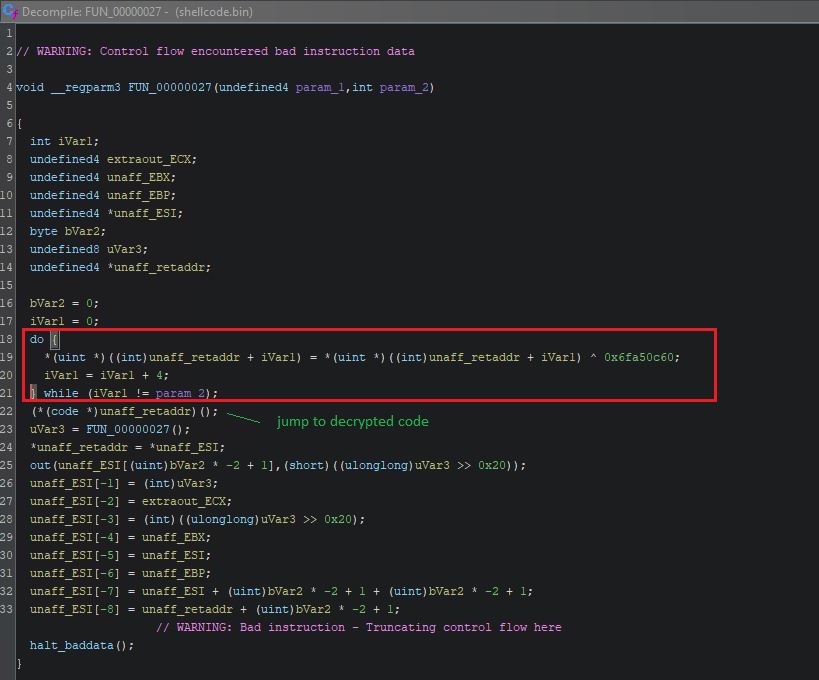
We can also observe the XOR loop in the decompiler view (CTRL+E in Ghidra):
We could obviously write a simple decryptor in Python, as the routine is a simple XOR with a hardcoded key. This time though, our goal is to use the Ghidra emulation engine to decrypt the rest of the shellcode.
First, we need to set a breakpoint, the same as we would be debugging the binary. To do that, right-click on the line with a jump to decrypted shellcode and choose “toggle breakpoint”.
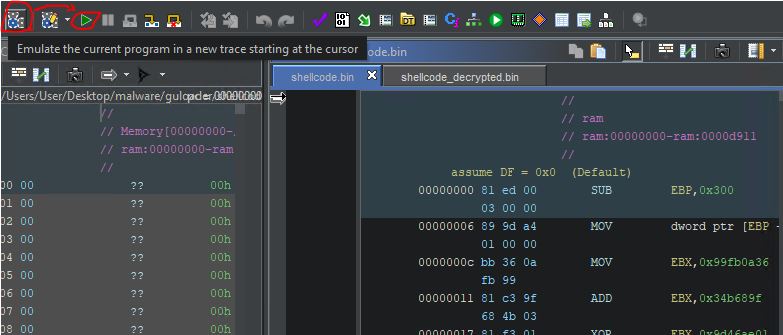
Aster setting a breakpoint we can execute (emulate!) our shellcode. For this, point a cursor (click) at the first instruction and press “Emulate the current program in a new trace starting at the cursor”. It will generate a new emulation environment with EIP set to the instruction we are currently at. It won’t start emulation yet. To do this, make sure breakpoints are correctly set and press the green arrow button (F5).
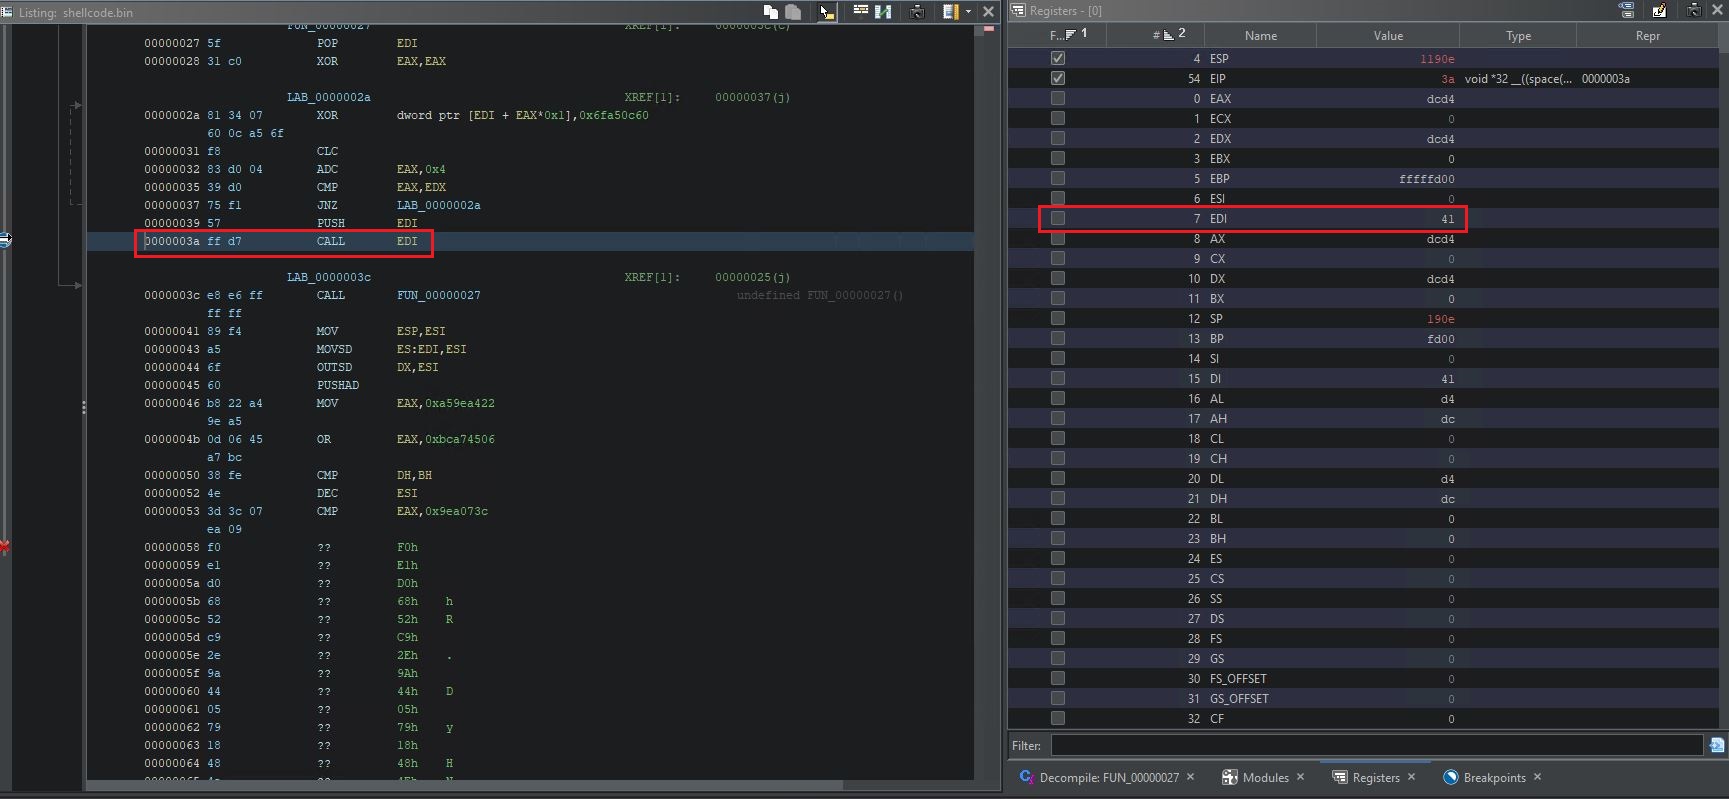
Now we should stop at the breakpoint, and our decryption routine should be completed. Notice that “Listing” window instructions will not change, nor will decompiled code. What will change is the dynamic listing. Also, our registers window should have valid register values after decryption. Notice EDI register value is set to 0x41. This is a memory location we will jump to after our indirect call.
If you start pressing “Step-in (F8), you will notice the code will start to disassemble into legitimate instructions. We can also speed up this process by pressing “D”.
At this point, our shellcode should be decrypted, but the decrypted version is only residing in the Ghidra emulated memory. There is also no way to decompile it (or at least I am not aware of one, if you know how to decompile the dynamic listing window without saving the memory to a new file, let me know).
The last thing we will do in this article is to save this decrypted code as a new file to analyze it further. For this, let’s move to a memory regions window, right-click on the first region (starting with 00000000), and press “Select Addresses”. This will select the entire memory region in the dynamic window. As this is our entire memory, Ctrl+A in the dynamic window should work as well.
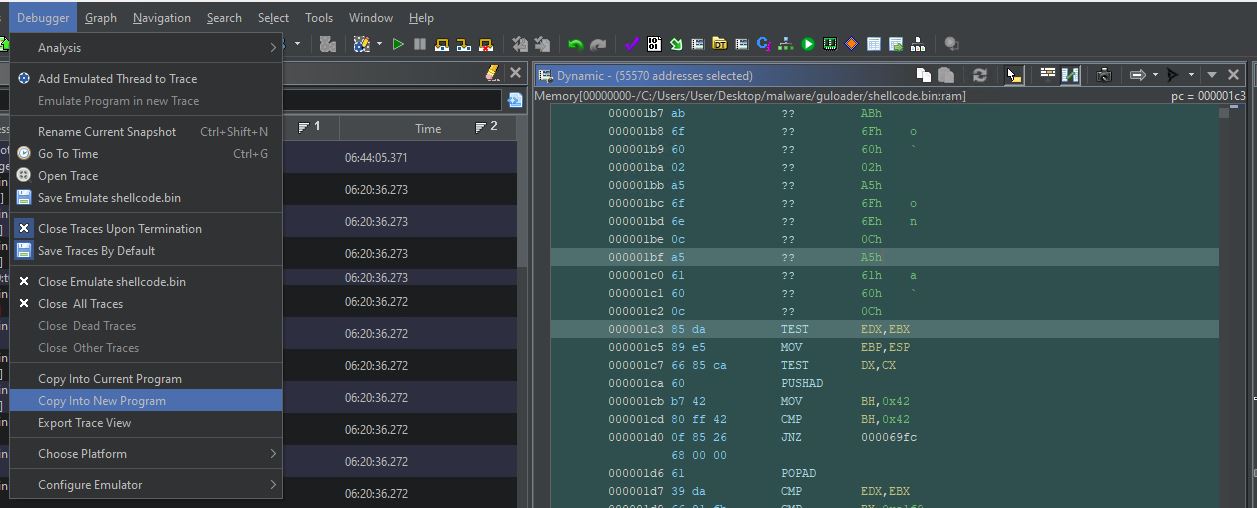
After the memory is selected, we need to choose “Copy Into New Program” from a Debugger menu.
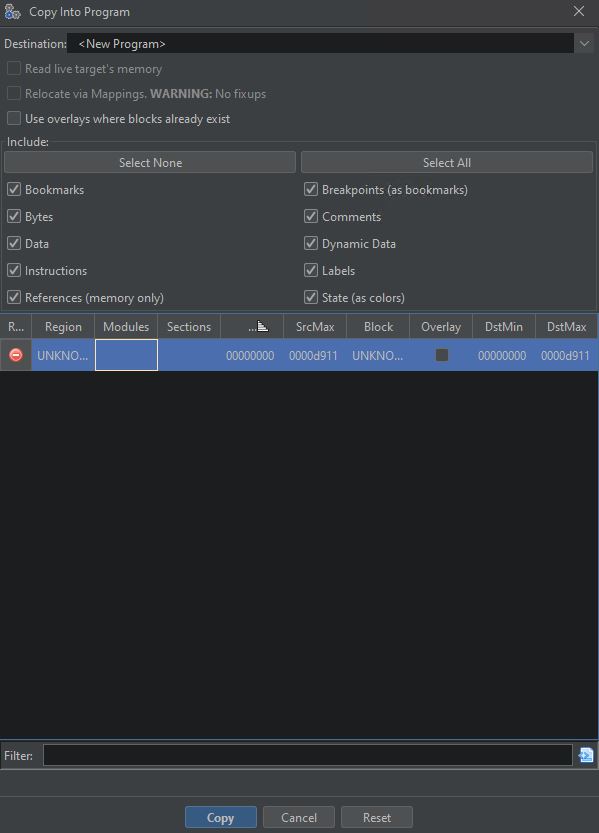
When the new window pops up, just press “Copy” and choose a new name for our decrypted file.
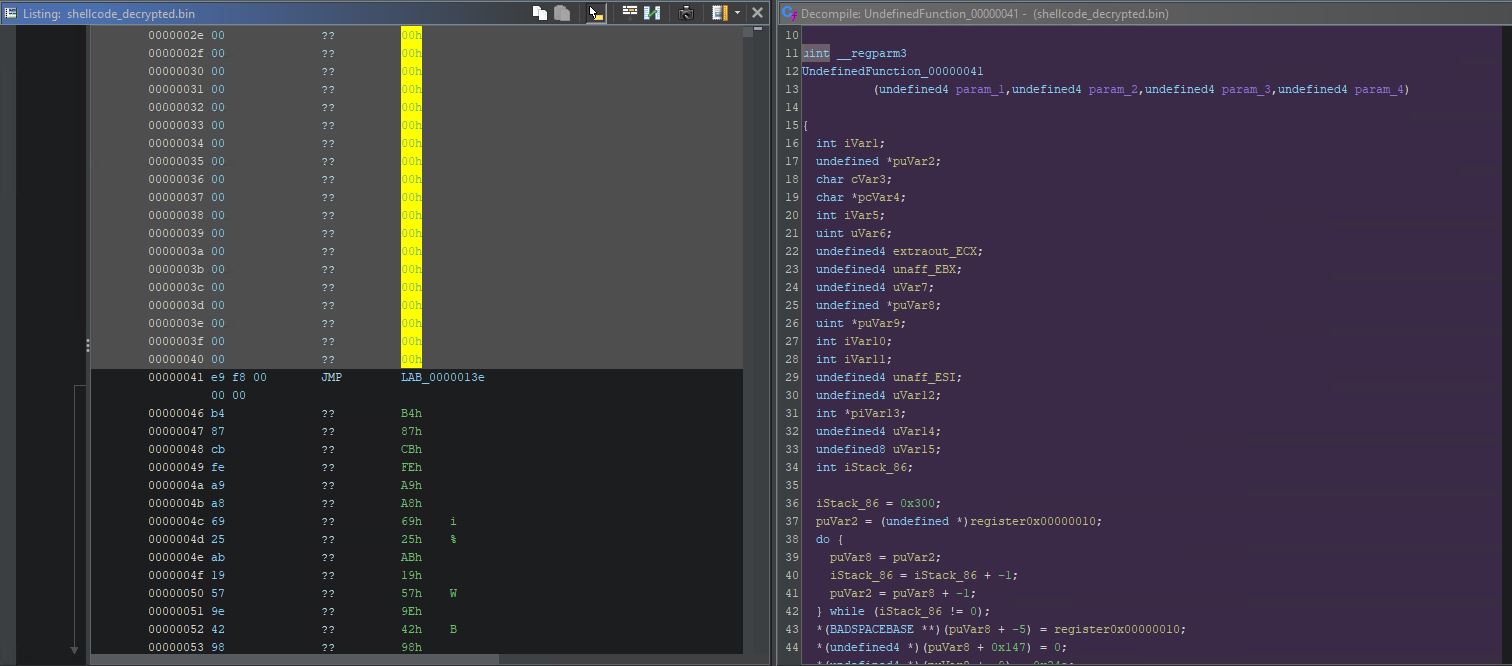
This should automatically add this new binary/shellcode to our project and open a new listing window with the decrypted code that can now be decompiled.
Now we can use this file to perform a further analysis.
This is it for this article. We acquainted ourselves with the basics of the Ghidra Emulator and used it to decrypt the first stage of the GuLoader shellcode. In future articles, we will see how we can use more advanced features of the Ghidra Emulator to further analyze GuLoader code.
